Resource Descriptive Chart
System Structure
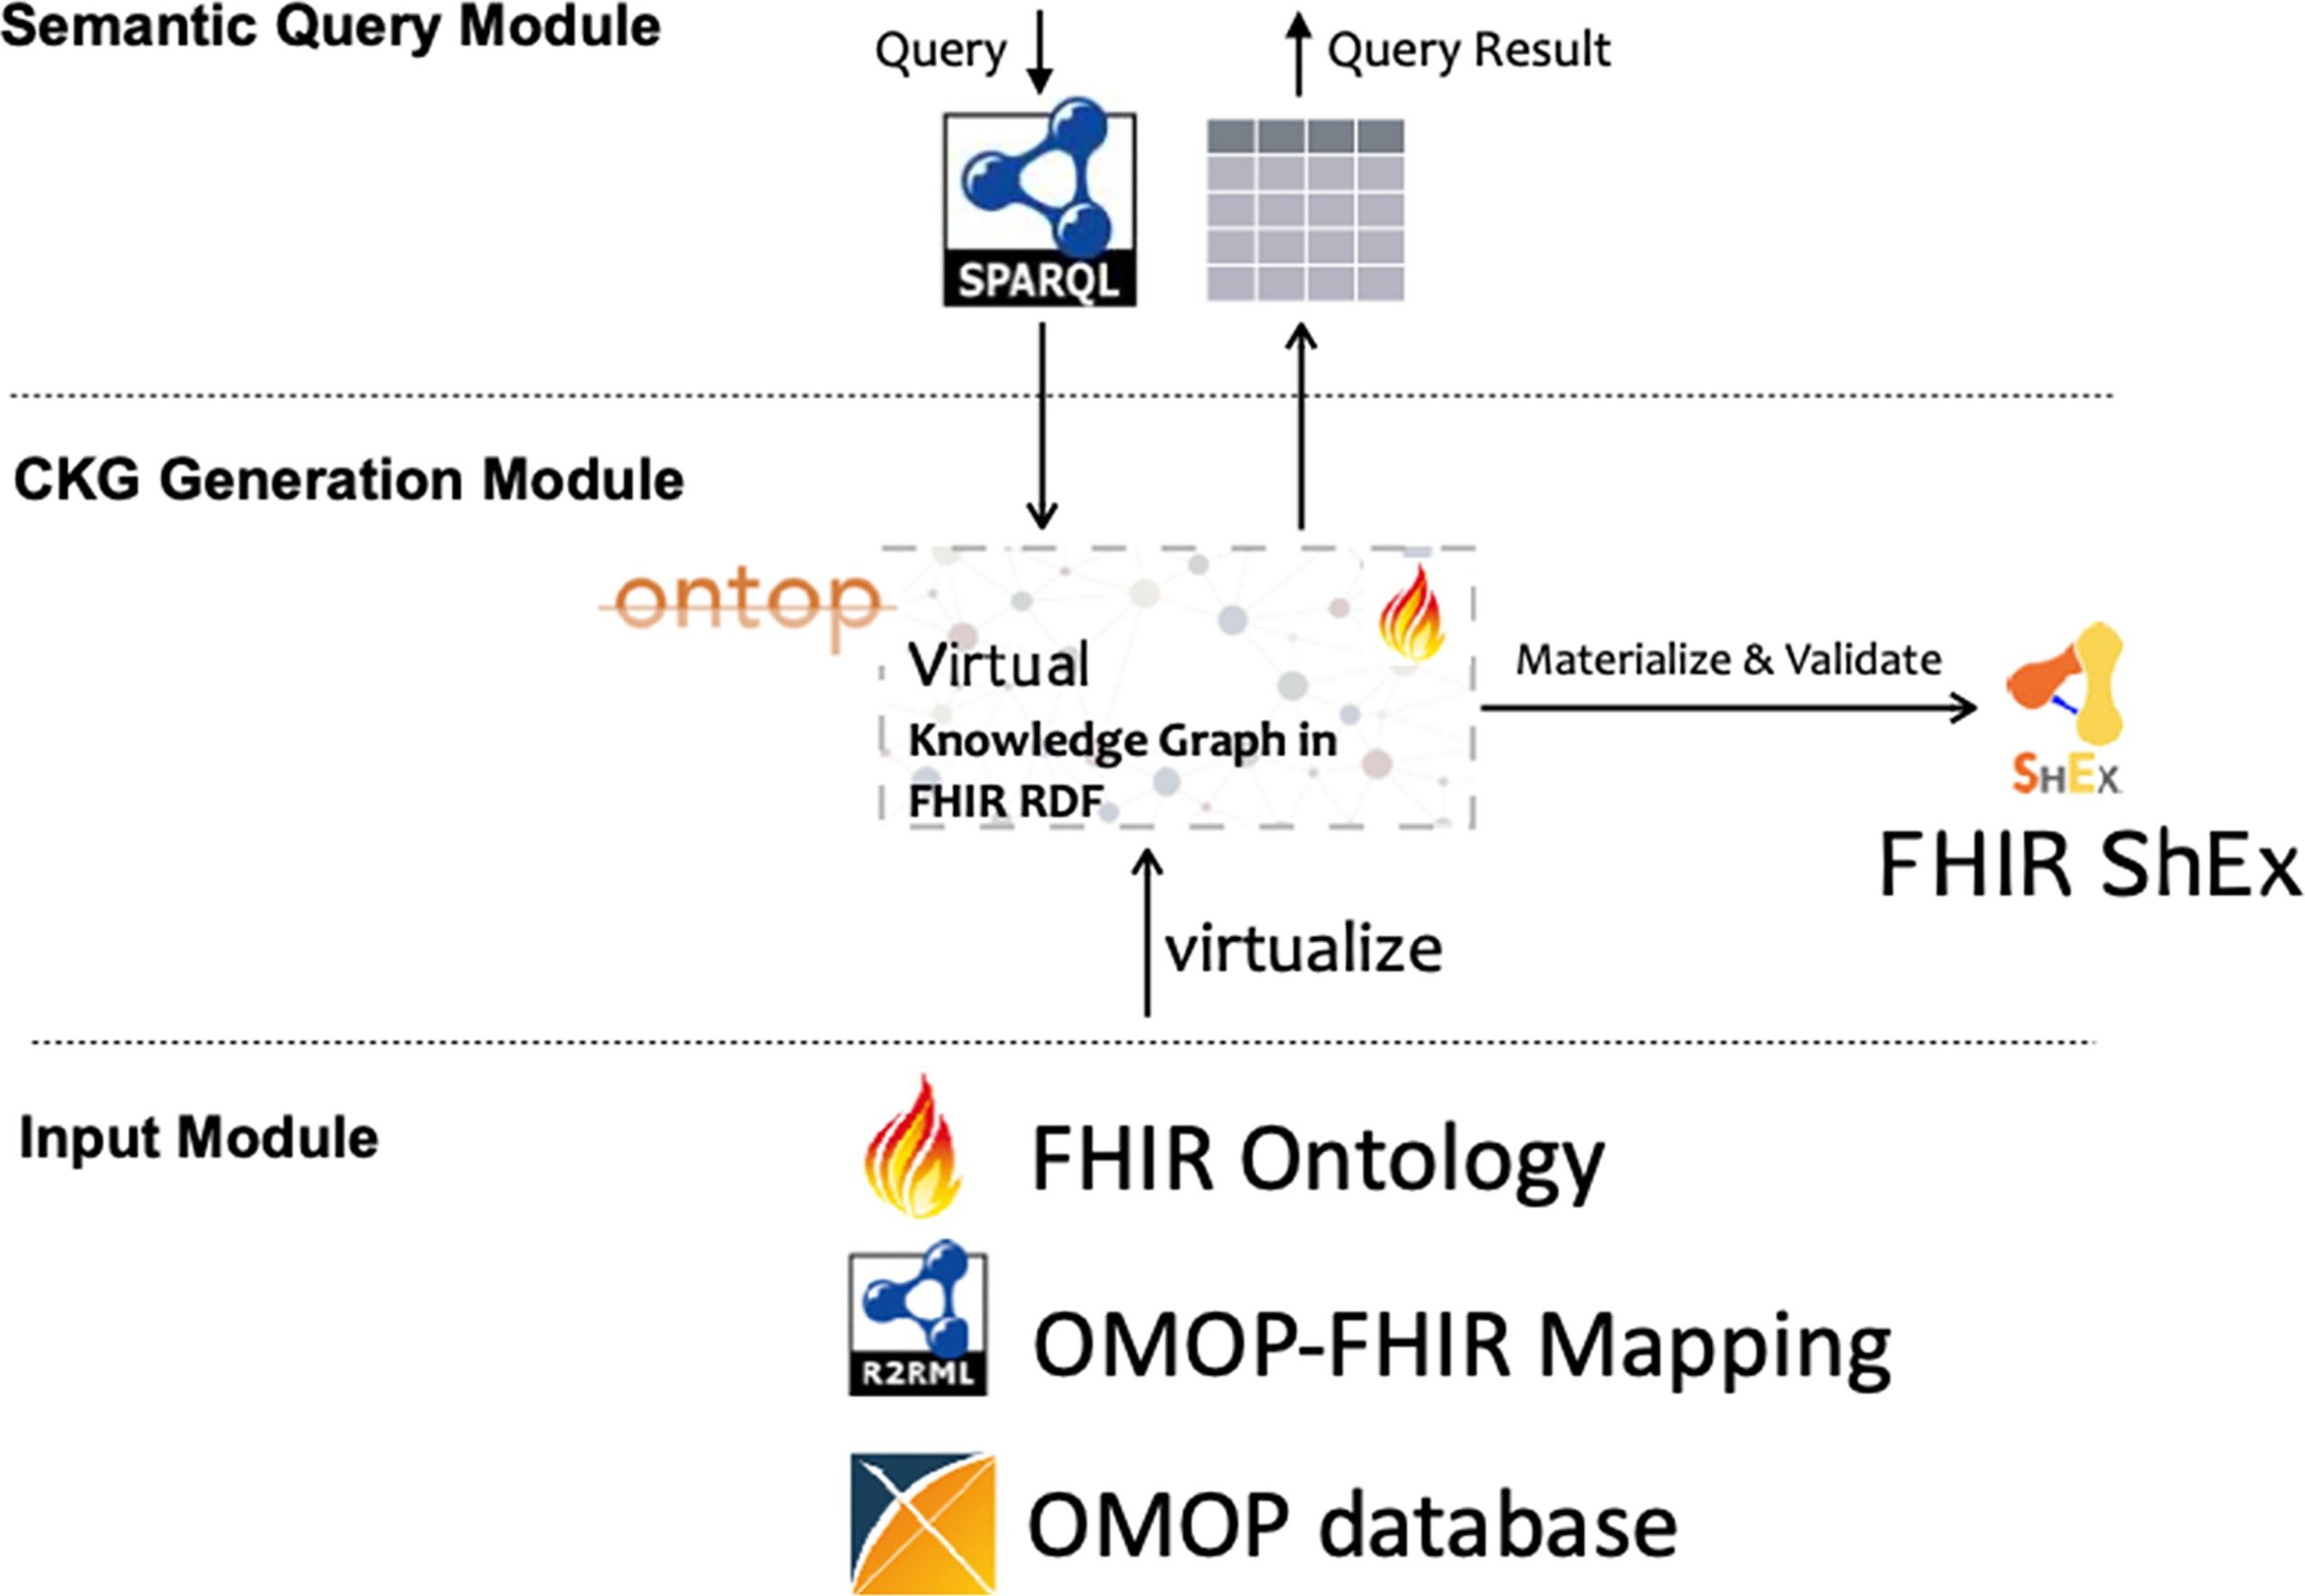
FHIR-Ontop-OMOP offers a unique design that enables users to query an OMOP database using SPARQL, thereby enhancing interoperability between the FHIR RDF and OMOP CDM data models. At its core, OMOP CDM serves as the underlying database structure. A crucial layer of mapping is applied over this database to transform the OMOP CDM data into Turtle format, ensuring it aligns with FHIR RDF standards. This transformation is key to bridging the two standards. Furthermore, FHIR-Ontop-OMOP provides an Ontop endpoint, enabling users to execute SPARQL queries. This feature is vital in making complex data queries more accessible and efficient within the combined framework of these standards.
The resources included in the database are:
| OMOP Table | FHIR Resource |
|---|---|
| PERSON | Patient |
| VISIT_OCCURENCE | Encounter |
| CARE_SITE | Location |
| CONDITION_OCCURENCE | Condition(Problem) |
| DRUG_EXPOSURE | MedicationStatement |
| LOCATION | Location |
| MEASUREMENT | Observation |
| PROCEDURE_OCCURENCE | Procedure |
| PROVIDER | Practitioner/PractitionerRole |
| CONCEPT | CodeableConcept/Coding |
| CONCEPT_RELATIONSHIP | ConceptMap |
| CONCEPT_ANCESTER | ConceptMap |
Resource Descriptive Chart
To better demonstrate the relationships existed among all the resources in our database, we have constructed a resource descriptive chart to provide visual explanation.
(hover your mouse over the image below to zoom in)
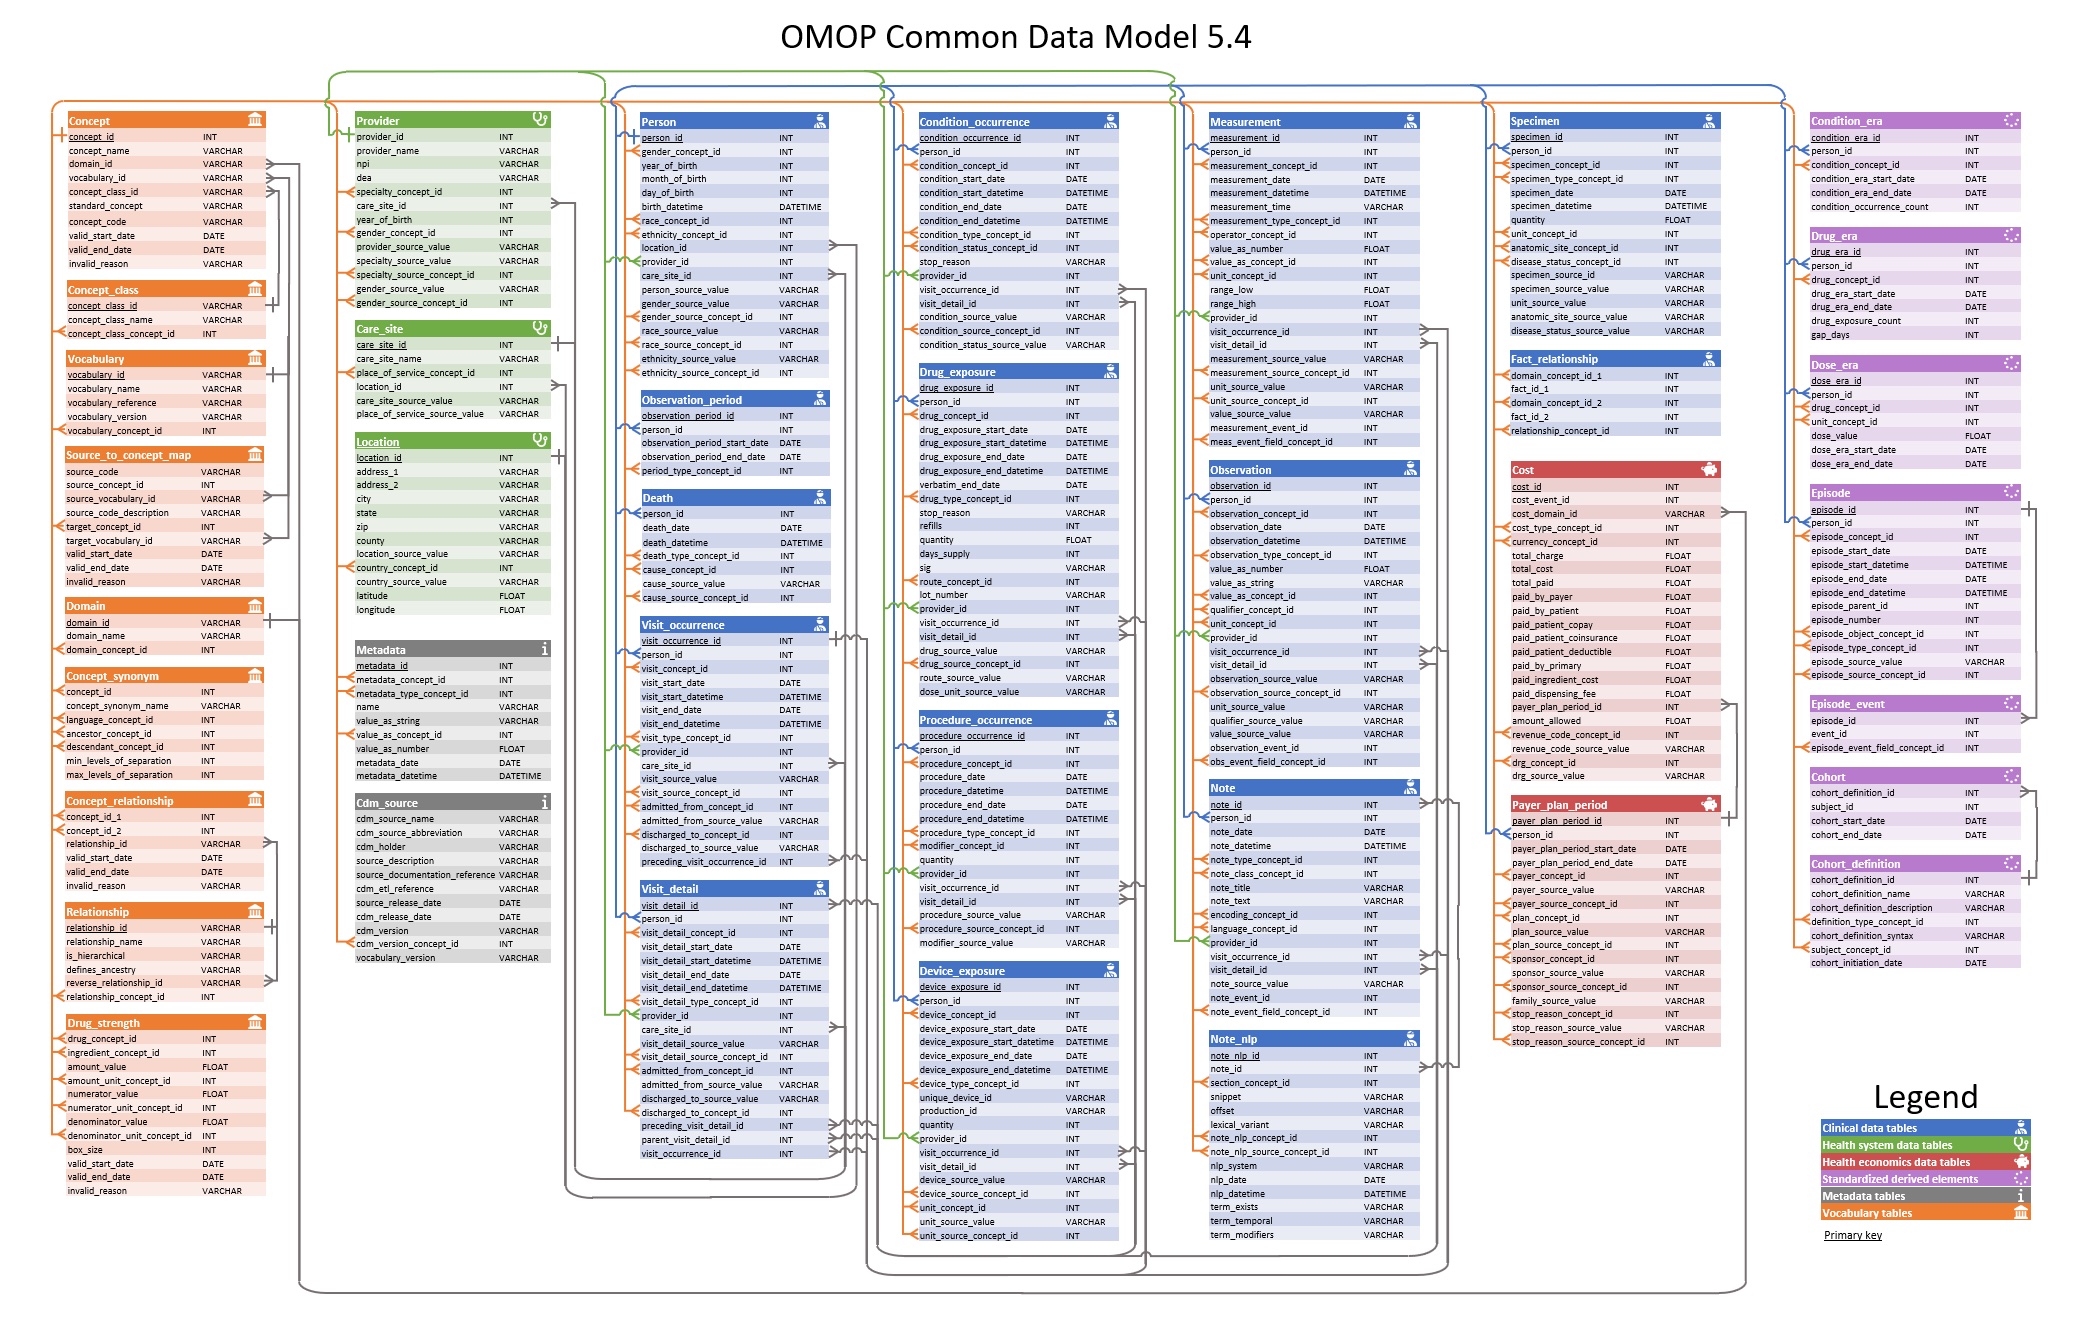
OMOP CDM Entity Relationship Diagram
(ERD of all tables designed in the common
data model)
Source: https://ohdsi.github.io/CommonDataModel/cdm54erd.html
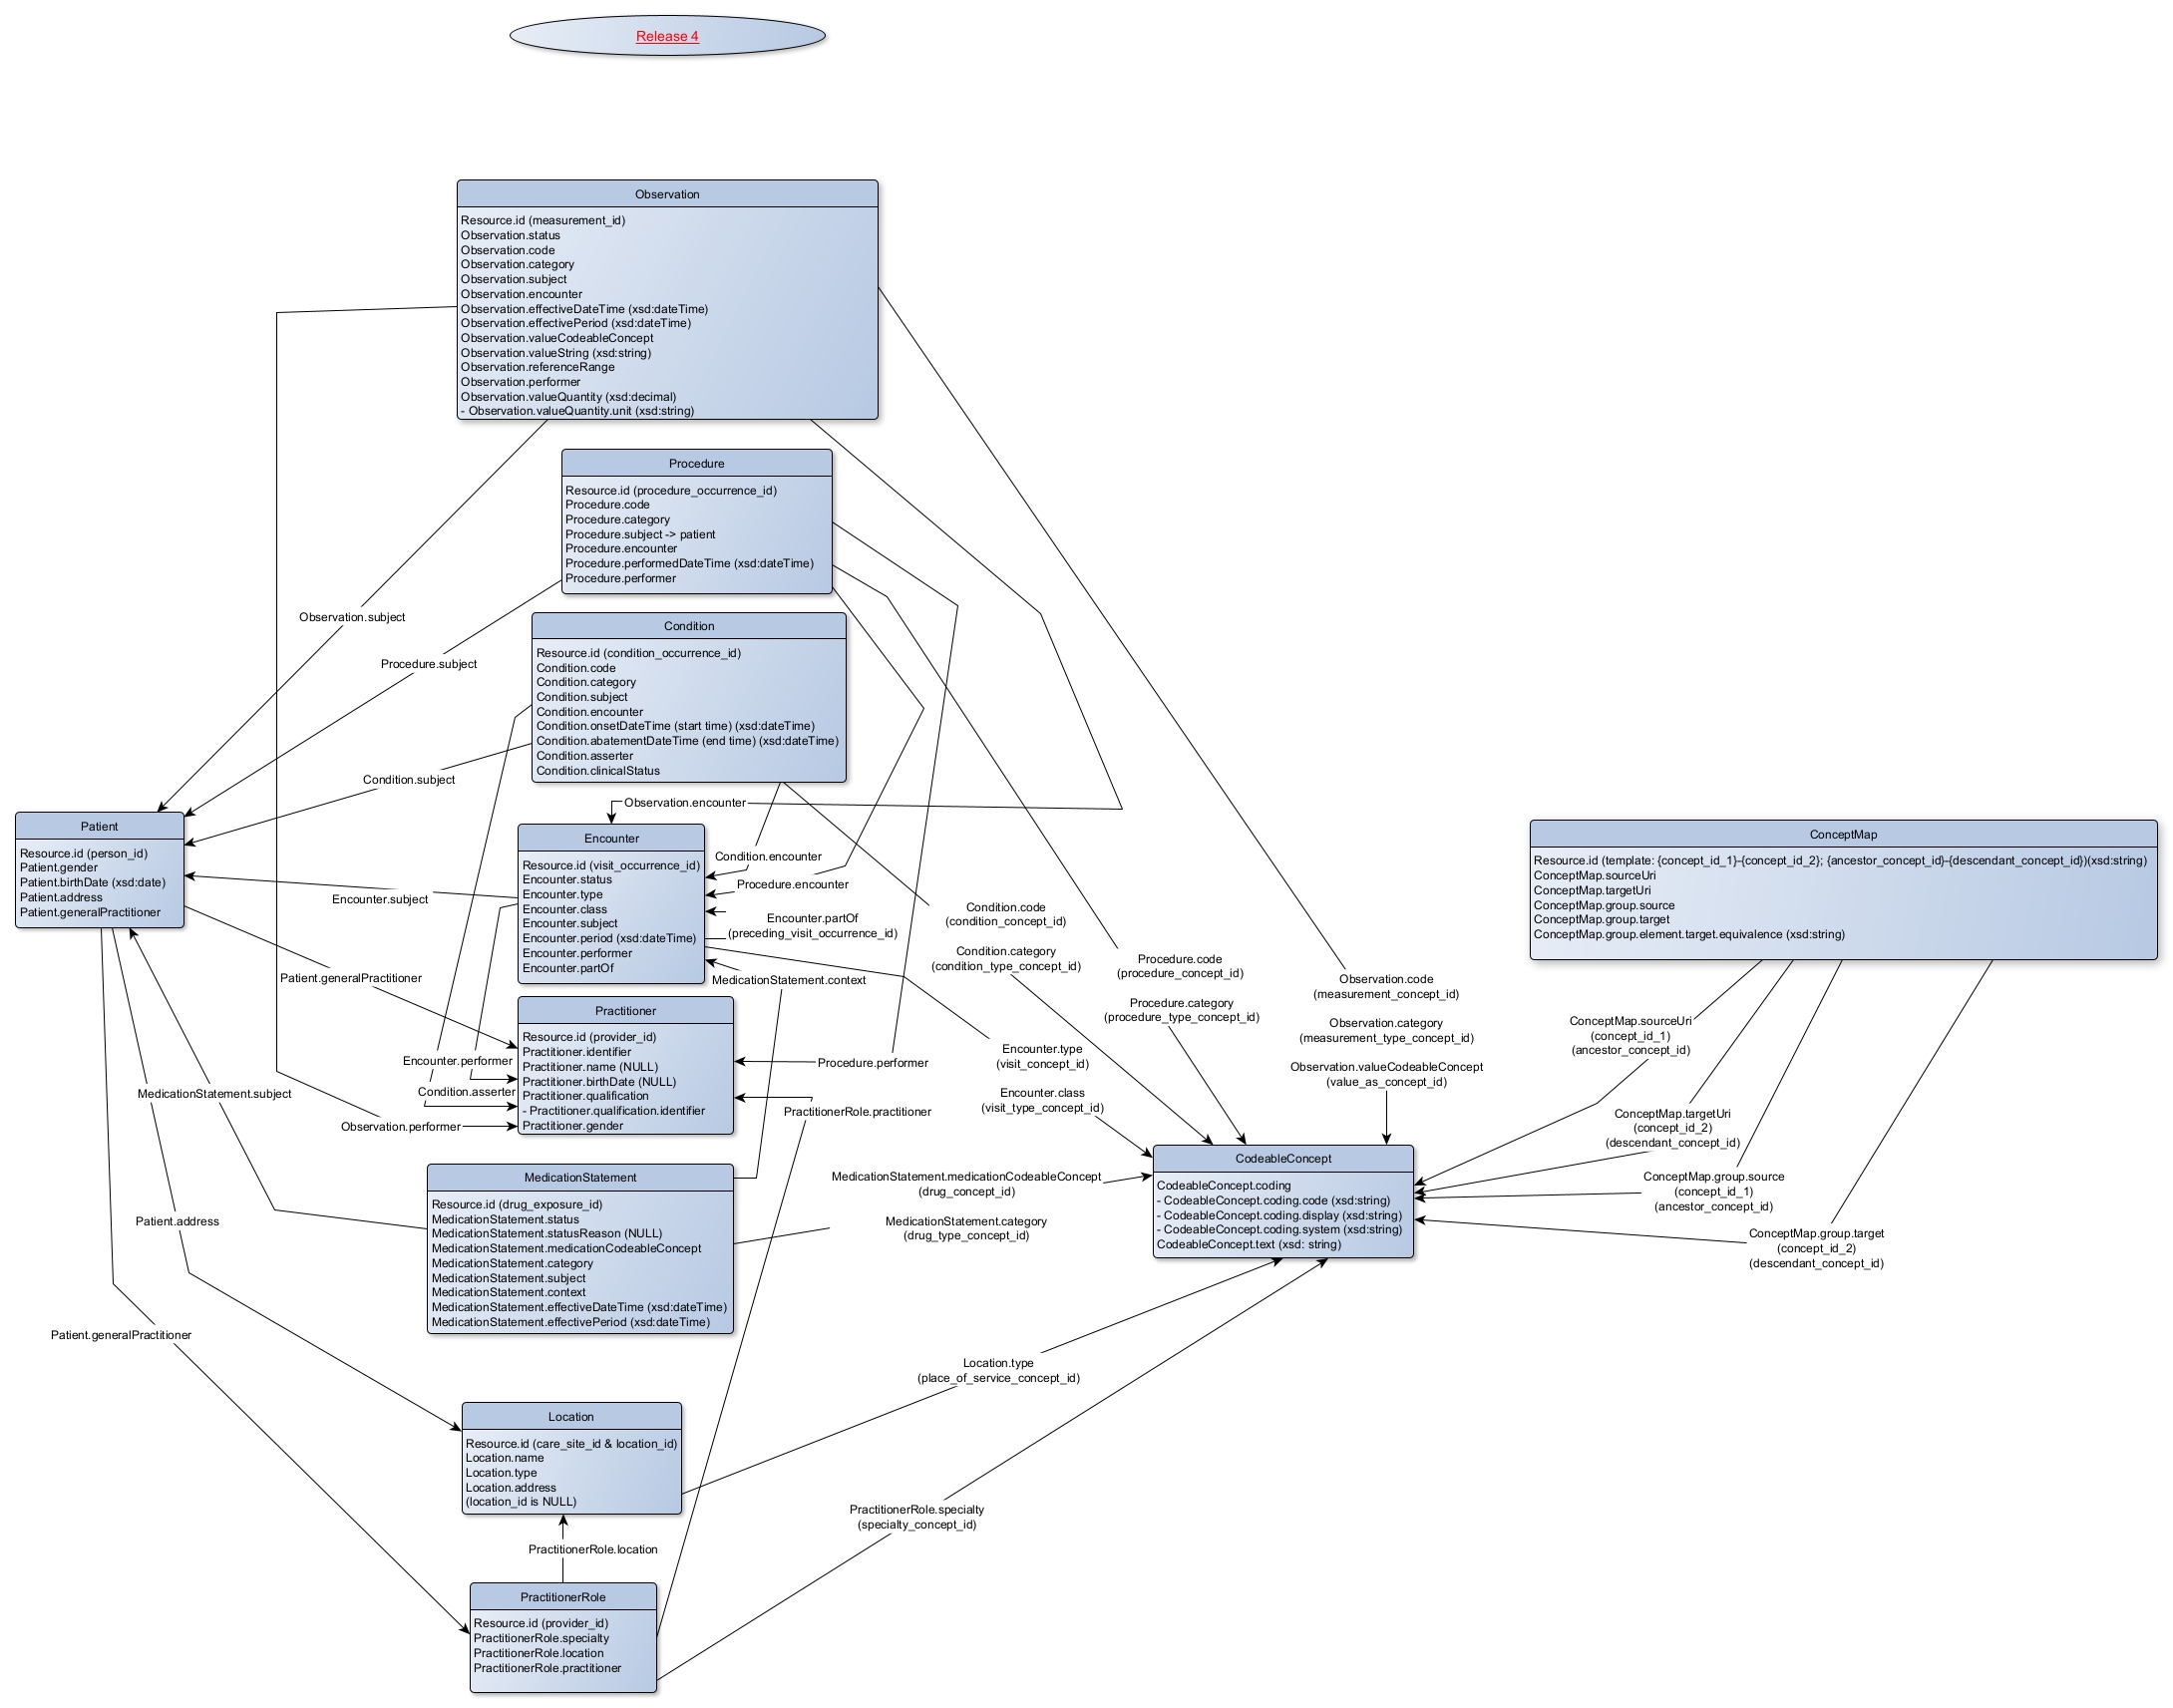
FHIR RDF Resource Descriptive Chart
(resources currently available in our virtual database)
Data stored in RDF (Resource Description Framework) formats uniquely preserves information about itself while linking to other resources. More importantly, it imbues these linkages with semantic meanings, thereby facilitating higher-level information inferences. This capability of RDF is instrumental in building more explainable AI models, as it allows for a deeper understanding of data relationships and contexts, essential in making AI decisions transparent and interpretable.
Resources in the database are:
| Resource | Description |
|---|---|
| Patient | Demographics and other administrative information about an individual or animal receiving care or other health-related services. |
| Observation | Measurements and simple assertions made about a patient, device or other subject. |
| Procedure | An action that is or was performed on or for a patient, practitioner, device, organization, or location. |
| Condition(Problem) | A clinical condition, problem, diagnosis, or other event, situation, issue, or clinical concept that has risen to a level of concern. |
| Encounter | An interaction between a patient and healthcare provider(s) for the purpose of providing healthcare service(s) or assessing the health status of a patient. |
| Practitioner | A person who is directly or indirectly involved in the provisioning of healthcare or related services. |
| MedicationStatement | A record of a medication that is being consumed by a patient. A MedicationStatement may indicate that the patient may be taking the medication now or has taken the medication in the past or will be taking the medication in the future. |
| Address | An address expressed using postal conventions (as opposed to GPS or other location definition formats). |
| PractitionerRole | A specific set of Roles/Locations/specialties/services that a practitioner may perform at an organization for a period of time. |
| CodeableConcept | A CodeableConcept represents a value that is usually supplied by providing a reference to one or more terminologies or ontologies but may also be defined by the provision of text. |
| PractitionerRole | A specific set of Roles/Locations/specialties/services that a practitioner may perform at an organization for a period of time. |
| ConceptMap | A statement of relationships from one set of concepts to one or more other concepts - either concepts in code systems, or data element/data element concepts, or classes in class models. |